Women remain under-represented in politics. This is also the case in Danish local politics, where female legislators comprise one third of the seats. This is puzzling given that elections to the city councils are salient, well-attended by voters and characterized by a low barrier to entry. Futhermore, Denmark is characterized as an egalitarian country. There are therefore no immediate structural reasons to why local politics in Denmark should be a man’s world. Malte Dahl and I try to explain why this is the case in our working paper Confident and cautious candidates: Explaining under-representation of women in Danish municipal politics. The research is supported by The Danish Institute of Human Rights.
We combine the two major approaches in the litterature. The demand-side perspective is concerned with understanding the causes of under-representation by considering the demand for specific types of candidates. If voters hold negative stereotypes against female candidates, it may contribute to undermining women’s electoral prospects. The second stream of research focuses on supply-side factors, specifically by exploring reasons for gender-differences in candidate emergence.
Local politics in Denmark
Denmark is characterized by a large degree of decentralization. The municipalities are responsible for around 50 % of the total government expenditure, which is the highest in Europe according to Eurostat. This budget is spend on a long range of public services such as schools, local infrastructure and social benefits. Local politics is therefore hugely important in Denmark, which is reflected in the turnout. In the local election in 2017, the national turnout was 70.6 %. Women were a little more likely to vote (72.4 %) than men (68.8 %).
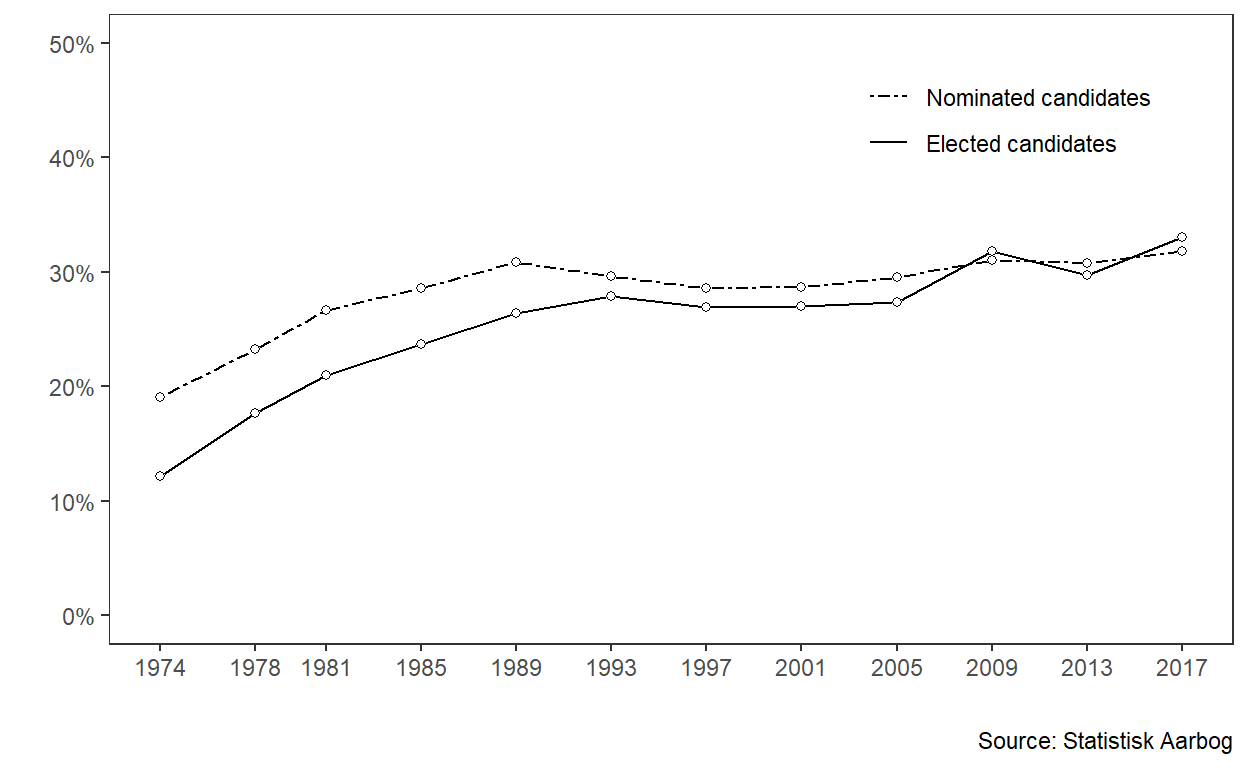
In 2017, 9,558 candidates were competing for 2,432 seats in the city councils. 31.8 % of the candidates were women, while 33.0 % of the elected members of the city council were women. This indicates that among the pool of candidates, women were slightly more likely to be elected given they were running as a candidate. This is supported by the actual distribution of votes. The median female candidate received 92 votes, while the median male candidate received 78 votes. It has not always been the case that women were more likely to be elected. In 1974, a male candidate was almost 60 % more likely to be elected than a female candidate. The share of female candidates running for office increased drastically in the 1970’ies and 80’ies, but stagnated in 1989 and has essentially remained constant ever since. The increase in the share of women in local councils since 1989 can therefore primarily be attributed to the fact that women are more likely to be elected than previously.
Share of women in Danish city councils
It is important to note that even though the descriptive results indicate that women are no less likely to be elected than men in recent elections, this does not entail that women do not face an electoral disadvantage due to bias among voters. For example, it may be that women that run for office are more qualified than men or that women face a disadvantage among certain groups of voters. In addition, it may be that there is less demand for female politicians from the voters, and that parties therefore strategically decide not to field female candidates. Likewise, potential female candidates may chose not to run if there is a systematic bias against them on behalf of the voters. Thus, an disproportionate supply may be a response to demand preferences. We therefore rely on experimental data to look at whether male candidates are preferred to female candidates.
Design and data
The main data source for the analysis is a survey of representative voters. In addition to the survey, we use additional observational data, which is obtained from Statistics Denmark and the national broadcasting company, Danmarks Radio. The survey was conducted in a commercial web panel (AnalyseDanmark), where panel members where invited by email to participate. A total of 2,123 respondents started the survey,and 1,551 completed the entire survey. Since we are interested in examining reasons to the initial decision about whether or not to engage in local politics, the population of interest is all potential candidates, i.e. a representative sample of Danish voters. This sample is especially viable in local politics because access is easy - candidates can often engage without a long history of party-membership, they can create their own party or run as non-party member - and a considerable amount of Danish citizens actually run at some point.
We use a paired-conjoint in which respondents are asked to choose their preferred candidate among two hypothetical political candidates described on seven attributes that could each hold two or more levels. Because the effects of each feature is measured on the same outcome, their relative importance can be evaluated. We estimate Average Marginal Effect Components (AMCE) by using linear regression. For example, we estimate the average difference in the probability of a candidate winning if he is male compared to female when the average for all other possible combinations of the other attributes is computed.
We measure whether people are interested in running as candidate by asking them the following question “Imagine that your preferred party encourage you to run as a candidate at the next local election. How likely is it that you would accept the offer?”. The respondents can then answer the question from a scale from 0 (Very unlikely) to 10 (Very likely). In the last part of the survey, respondents were asked the questions that we use to evaluate reasons to run for office. We relied on four statements and asked participants to indicate whether they agreed with the statement on a 5-point likert-scale, where 5 is “Agree strongly” and 1 is “Disagree strongly”. The four statements are: (1) I am interested in local politics; (2) I am qualified to participate in local politics; (3) I have the time to engage in local politics and finally (4) If I ran as a candidate for the city council, I would be elected.
Is there less demand for female politicians?
Are female candidates less preferred by the Danish voters? The figure below gives the results from the conjoint experiment. In other words, each estimate is the difference in the likelihood of being preferred as candidate compared to one omitted feature level (the reference category) when averaging over all other features. The results for all candidates are shown in the first row and render little support for the notion that voters exhibit a bias against female candidates. In fact, voters seem to have a small preference for female candidates over male candidates by 1.8 percentage points. The figure also shows a number of other interesting results. For example, it is seen that candidates with Arabic names are less preferred, while candidates with political experience are favoured by the voters. However, unsurprisingly the effect sizes are biggest on the policy questions, where voters on average have a negative view of candidates, who want to lower the taxes and are against socially diverse schools. In the article, we furthermore test whether female candidates are judged differently by the voters than male candidates, but find that this generally is not the case. The results are shown in the second and third row in the figure below.
Conjoint experiment: Effect of candidate attributes 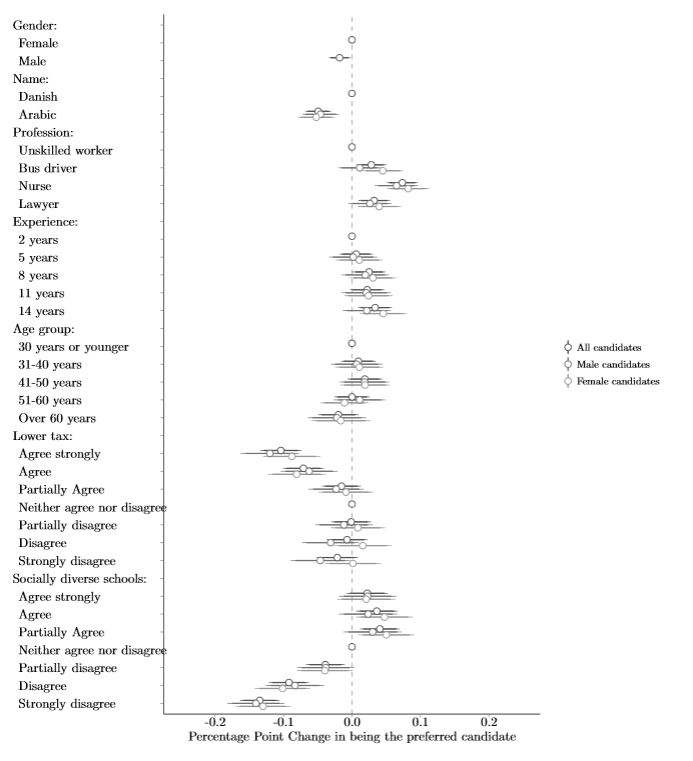
Overall, the results indicate that Danish voters broadly favor female candidates in local elections. However, this does not entail that female candidates do not face a disadvantage among certain types of influential voters. We therefore test for effect heterogeneity. This is seen in the figure below.
Conjoint experiment: Effects of being male for different types of voters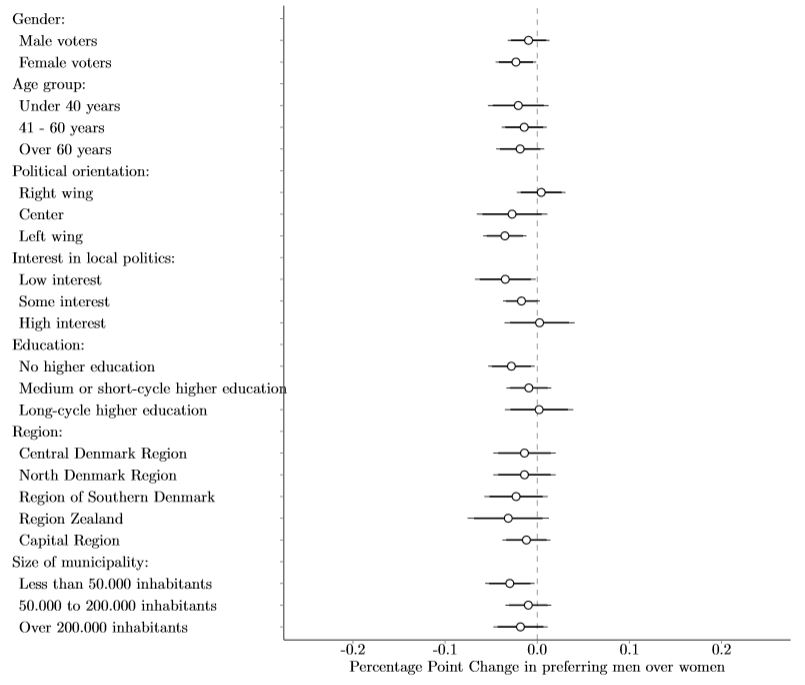
The figure indicates how much less (or more) a male candidate is preferred to a female candidate across different types of voters. If the dot is to the left of the baseline a female candidate is preferred and vice versa. On a scale from 1 to 5, a voter, who answered 1 or 2 is coded as having “low interest”, 3 or 4 as having “some interest” and 5 as having “high interest”.
The experiment shows that female candidates are preferred by both male and female voters, although the difference is only significant for female voters. Likewise, all age groups prefer female candidates in the conjoint experiment. If we look across the political spectrum, it is seen that left-wing voters have a strong preference for female candidates, while right-wing voters are indifferent to the gender of the candidate. Furthermore, it is seen that voters, who have little interest in local politics, have a stronger preference for female candidates than voters, who are very interested.
If we instead turn towards geographic patterns, we see that female candidates are preferred across all regions and in both small and large municipalities. In fact, voters in less populous municipalities are those, who favor female candidates the most. These voters have a disproportionate impact on the overall gender balance. In the smallest municipality, Læsø, there are 143 votes per member of the city council, while there are 5,554 votes per member of the city council in Copenhagen. The data renders little support for the thesis that specific types of influential voters have a strong preference for female candidates, which would put female candidates at a disadvantage in the election booth. Across all demographic groups, we can only find two groups, who indicate that they on average prefer male candidates by more than 2 percentage points, namely right-wing women and highly-educated men.
In sum, there is little evidence, which support the demand-side explanation. Danish voters overall have a preference for female candidates, and female candidates seem to have charac- teristics, which align better with the preferences of the voters. We do, however, find one result, which may put female candidates at a disadvantage. Namely, that they to a higher degree face an incumbency disadvantage. Nonetheless, in light of the remaining evidence, it is hard to believe that this account for the relatively large under-representation of women in Danish local politics.
Are women less likely to want to run for office?
The results indicate that demand-side explanations are insuficient to explain the gender imbalance in local Danish politics, and we therefore turn toward supply-side explanations. First, we examine differences in how likely respondents are to run as a candidate if they were encouraged to run by their preferred party. In the analyses below, a person is defined as being likely to run if they answer 5 or more on a scale from 0 (Very unlikely to run) to 10 (Very likely to run). The substantive results remains similar if we use another cut-off point.
We find large overall differences across genders. 27 % of the male respondents reported that they were likely to run, while 17 % of female respondents indicate that they were likely to run if encouraged to do so. In a representative sample of Danes, women therefore indicate that they are significantly less likely to run for a local election than men. It should be noted that there are low barriers to entry and that around 1 out of 400 voters run for office at any given election.
Share who say they are likely to run as a candidate if they are encouraged to run by their preferred party
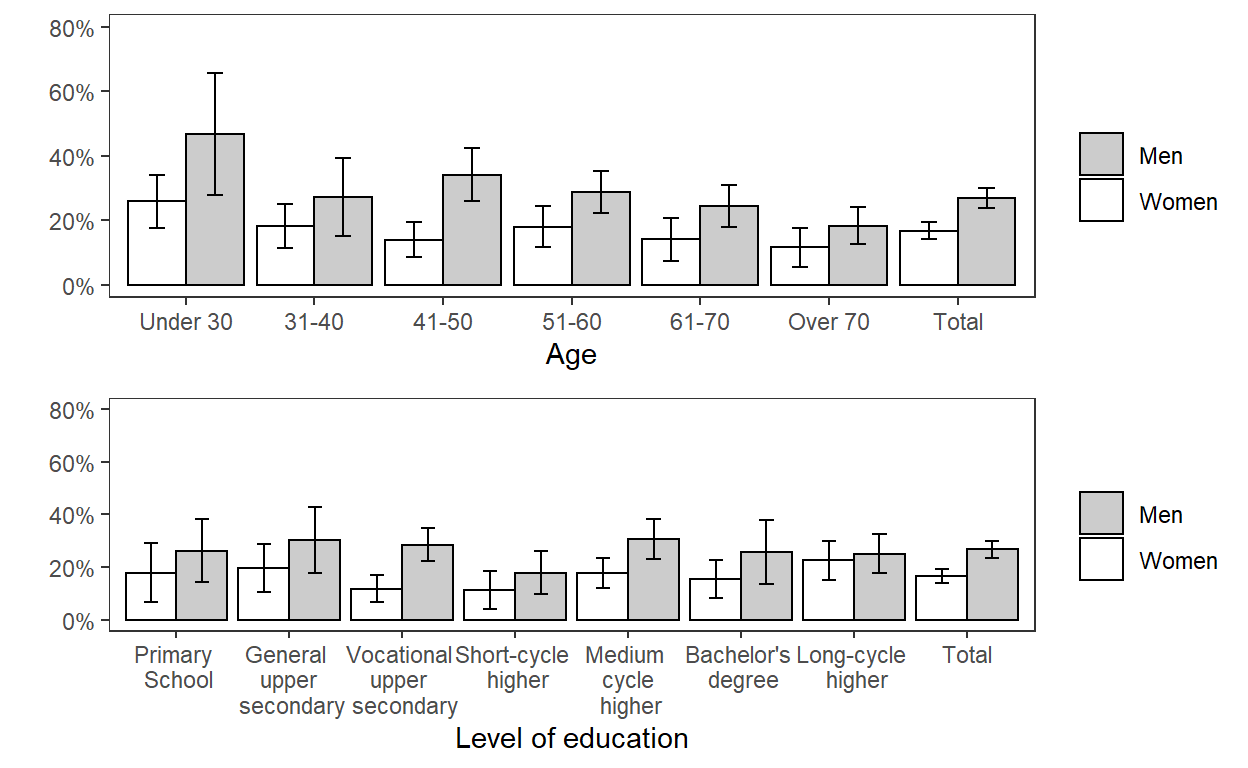
A person is defined as being likely to run if they answer 5 or more on a scale from 0 (Very unlikely) to 10 (Very likely). N = 1.510. 746 men and 764 women.
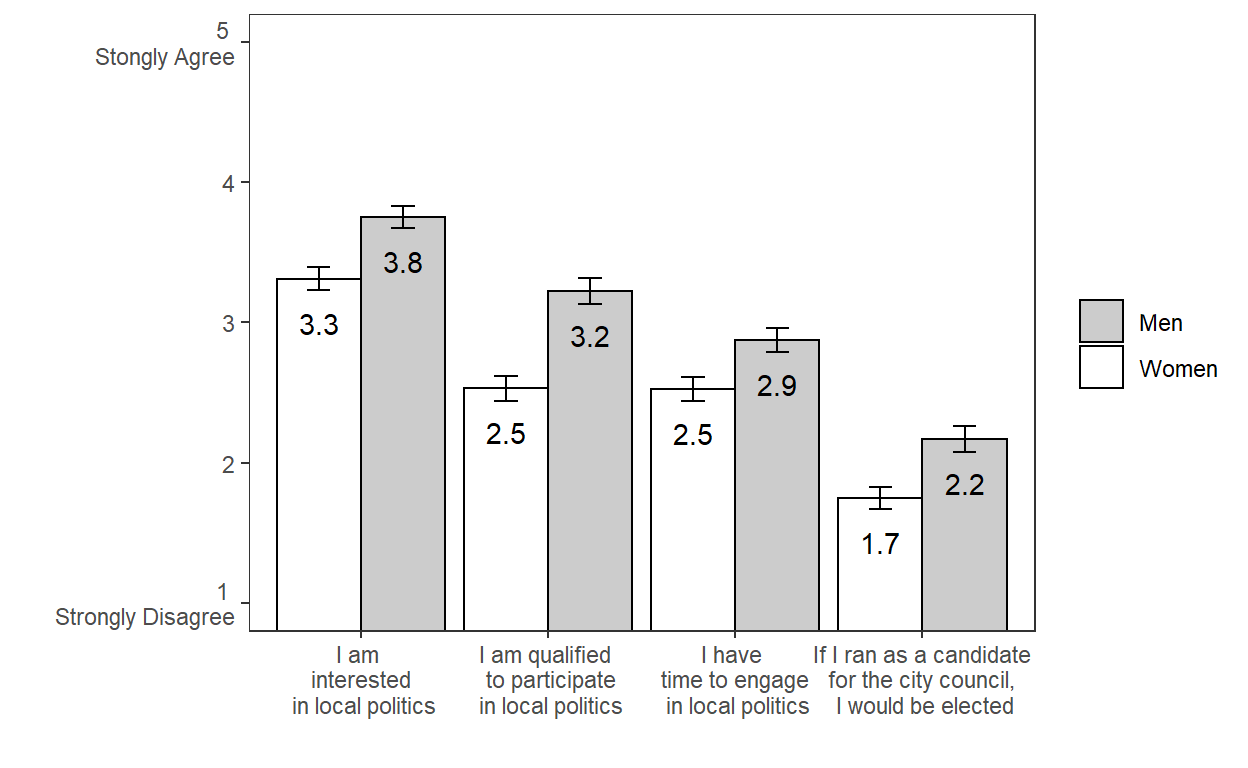
There can be a number of reasons for why, women are less likely to run for office. We examine four mechanisms, which are rooted in the literature. In the figure below, we plot the average score for men and women across the for mecahnisms. On average, men score themselves significantly higher on all four dimensions. First, we look at self-perceived qualifications which, according to Fox and Lawless (2011), is the “most potent” explanation for willingness to run for political offce. On this question, there is a difference on 0.7 – a substantial difference considering the 5-point scale. Additionally, men are more interested in local politics (.5) compared to women, who also are more reluctant to answer that they have the time to engage in local politics (.4). Finally, men are more confident (0.5) that they will be elected should they decide to run for office.
To which degree do you agree with the following statement?
In order to test, whether these factors are related to a person’s likelihood of running, we run a regression analysis. In model 1, we see that women are significantly less likely to run. This is not a surprise given the results from above. In the following models, the variables from the figure above. Individually, all four variables are positive and significantly associated with likelihood of running. Since they are measured on the same scale, they are directly comparable. It is seen that the association is strongest for feeling qualified and belief in being elected, while it is weaker for time and interest. Furthermore, it is seen that the association between female and likelihood of running for office disappears when feeling qualified is added to the regression, while it is only weakened by the three other variables. In model 6, the four questions are added collectively, and it is seen that there is no significant association between being female and likelihood of running for office, when these factors are taken into account. In model 7, we include a range of background variables and in model 8 we include variables concerning political beliefs and party-membership. Among other things, it is seen that older people are less likely to being interested in running for office, while people, who either lean left or right are more interested in running than people at the center. Although the chain of causation is unclear, the results indicate that self-perceived qualifications and confidence in being elected are important for understanding both the the overall likelihood of a respondent being interested in running for office - and in explaining the gender gap on this question.
| Dependent variable: | ||||||||
| Likelihood of a person being interested in running | ||||||||
| (1) | (2) | (3) | (4) | (5) | (6) | (7) | (8) | |
| Female | 0.57* | 0.38* | 0.45* | 0.08 | 0.28 | 0.05 | 0.17 | 0.22 |
| (0.14) | (0.14) | (0.14) | (0.15) | (0.15) | (0.16) | (0.17) | (0.18) | |
| I am interested in politics | 0.53* | 0.09 | 0.19* | 0.20 | ||||
| (0.08) | (0.09) | (0.10) | (0.10) | |||||
| I have time to engage in local politics | 0.44* | 0.08 | 0.12 | 0.15 | ||||
| (0.06) | (0.08) | (0.08) | (0.08) | |||||
| I am qualified to participate in politics | 0.77* | 0.47* | 0.44* | 0.40* | ||||
| (0.07) | (0.08) | (0.09) | (0.09) | |||||
| If I ran as a candidate I would be elected | 0.78* | 0.48* | 0.48* | 0.52* | ||||
| (0.07) | (0.08) | (0.08) | (0.08) | |||||
| General upper secondary education | 0.41 | 0.35 | ||||||
| (0.38) | (0.40) | |||||||
| Vocational upper secondary education | 0.31 | 0.27 | ||||||
| (0.32) | (0.33) | |||||||
| Short-cycle higher education | 0.81* | 0.85* | ||||||
| (0.31) | (0.32) | |||||||
| Medium-cycle higher education | 0.82* | 1.10* | ||||||
| (0.40) | (0.42) | |||||||
| Bachelordegree | 0.56 | 0.62 | ||||||
| (0.37) | (0.38) | |||||||
| Long cycle higher education | 0.76* | 0.70* | ||||||
| (0.32) | (0.34) | |||||||
| Age | -0.03* | -0.03* | ||||||
| (0.01) | (0.01) | |||||||
| Central Denmark Region | 0.05 | 0.09 | ||||||
| (0.22) | (0.23) | |||||||
| North Denmark Region | 0.03 | -0.08 | ||||||
| (0.29) | (0.31) | |||||||
| Region Zealand | 0.28 | 0.31 | ||||||
| (0.25) | (0.26) | |||||||
| Region of Southern Denmark | 0.25 | 0.25 | ||||||
| (0.22) | (0.23) | |||||||
| Not a party member | 0.08 | |||||||
| (0.24) | ||||||||
| Left-Right Scale | -0.31* | |||||||
| (0.12) | ||||||||
| Left-Right Scale, squared | 0.03* | |||||||
| (0.01) | ||||||||
| Constant | -1.54* | -3.39* | -2.73* | -3.73* | -3.10* | -4.40* | -4.12* | -3.73* |
| (0.11) | (0.30) | (0.21) | (0.24) | (0.19) | (0.34) | (0.48) | (0.64) | |
| Observations | 1,216 | 1,216 | 1,216 | 1,216 | 1,216 | 1,216 | 1,201 | 1,113 |
| Log Likelihood | -641.50 | -613.23 | -613.32 | -557.20 | -562.24 | -534.07 | -514.14 | -479.62 |
Note: Analysis based on logistic regression. Dependent variable is “Likely to run”. Only respondents, who have answered the questions to all four statements are included. p<0.05.
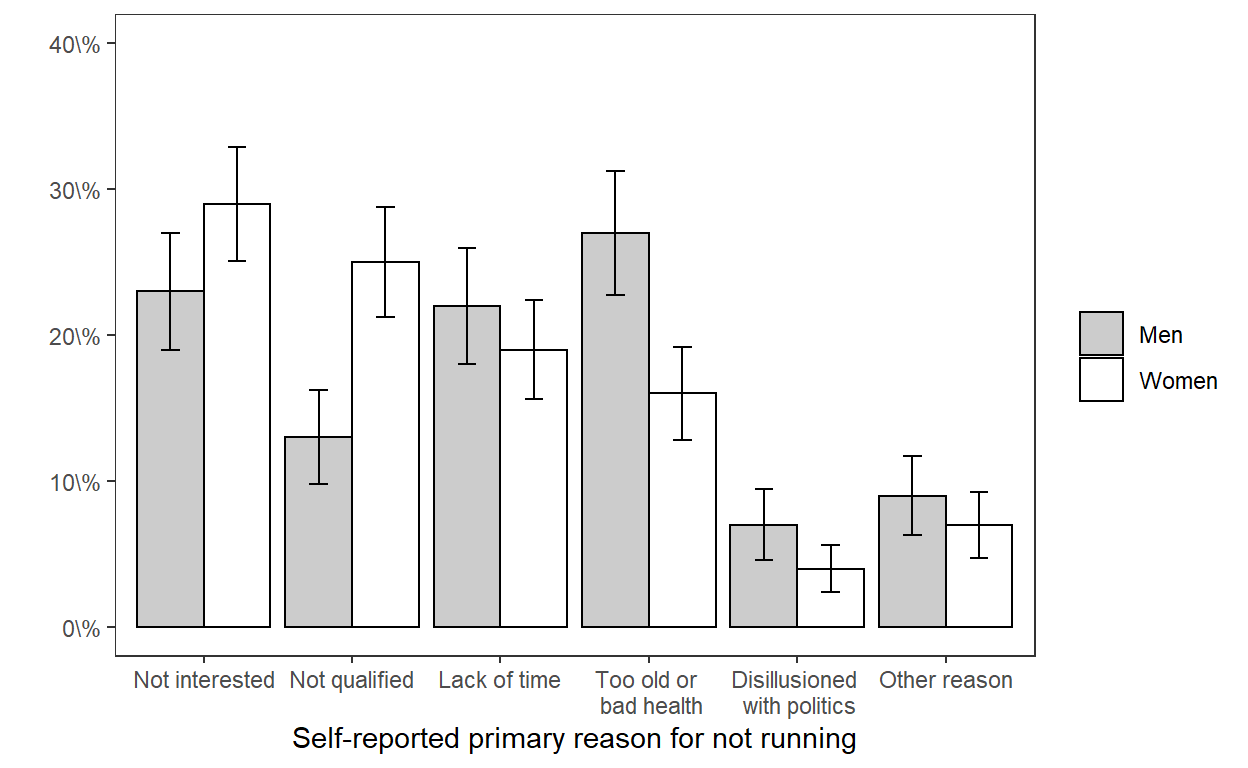
The findings from the regression analysis are supported by the self-reported reasons provided by the respondents. We asked all respondents to give a supplementary qualitative comment to the question on whether they would consider running as a candidate. The respondents could therefore provide whatever explanation they felt was relevant. Women were much more likely to answer that they were not qualified to run for non-physical reasons (25 %) than men (13 %), while men more often argued that they were not running due to physical reasons such as old age or bad health (27 % for men and 16 % for women). This points towards a clear pattern in the answers across genders. Women more often argue that they do not feel confident running as a candidate and give explanations such as “I have no experience with politics, and I would be bad at debating” and “Other people would be way more qualified than me”. Men, on the other hand, rarely argue that they do not have the competencies. Instead, a typical argument is “This is not where I want to spend my time” or “I am working as a lawyer and do not want to display my political beliefs”. Men therefore tend to believe that they would be capable of doing the job, but that their energy would be better spend elsewhere or that it will be bad for their career.
In both the qualitative and the quantitative, the main diffirence between women and men is that women systematically judge themselves lower on measures of self-efficacy. This is related to a significantly lower willingness to run. Overall, we therefore find that this is likely to be the key driver of under-representation of women in Danish local politics.
Respondents self-reported reason for not wanting to run as a candidate for the local city council
Conclusion
Overall, we find little support for any demand-side explanation. On the other hand, the evidence shows that critical gender differences exist at the candidate emergence phase. A candidate conjoint experiment shows that Danish voters in general have a slight preference for female candidates in local elections. Moreover, we find that male and female candidates with identical traits are evaluated almost similarly. Furthermore, it seems to be the case that female candidates in the actual pool of candidates have traits that align more closely with the preferences of the voters in our study. We also find that the preference for female candidates is consistent across various respondent characteristics. When considering supply-side explanations, we find that female voters are far less likely than men to consider running for office, and therefore emerge in the pool of potential candidates.
Thus, even though women who run for office are just as likely as men to get elected, the candidate emergence process results in a smaller ratio of women than men, who run for office. We consider different mechanisms as to why this is so. Although we cannot establish a full causal explanation, we find gendered differences on a number of issues that previous research have elicited as important to emerge. Most importantly, the women in our study are less confident that they are qualified to run for office compared to the men. This variable is strongly associated with whether a person is willing to run or not, and this result is supported by the respondents qualitative answers. Secondary, men express greater belief in their chances of being elected should they run for office, express greater interest in politics and report that they have more time to engage in local politics. These general findings are supported by descriptive data, which indicate that women at the election in 2017 are more likely than men to be elected, but that the share of female candidates are smaller.
Our study sheds light on ongoing debates both in political science and more broadly in discussions of the implications of representation. First, the difference in willingness to run may to some extent be self-reinforcing. Our results suggest that if a political gate-keeper wants an even amount of female and male candidates, the person would need to ask 60 % more female voters than male voters to fill the slots. Therefore, if a person has limited resources to find potential candidates, it would be efficient to ask men rather than women. Moreover, the lack of women in politics may reinforce ideas that deter women from running in the first place. There is evidence that high-profile female politicians play a symbolic role in motivating other women to run (Ladam, Harden, and Windett 2018) and that the presence of female politicians increase women’s interest in politics and political knowledge (Wolbrecht and Campbell 2017; Dassonneville and McAllister 2018). Second, if the mechanisms that we point out leads more women than men to opt out of participating in political activities at the initial stage, it yields lower levels of political experience and knowledge, which leads to lower levels of qualifications and confidence creating a negative feedback loop. Ultimately, this implies that qualified candidates are left out of politics.
As long as women are more likely than men to doubt their political qualifications and abilities to win an election, the gender gap in local politics will likely flounder. As seen in an appendix, data from the latest elections suggests that younger cohorts of politicians are somewhat more even on gender balance than older cohorts, but that the share of female candidates under 30 years of age has dropped. This suggest that we cannot take the issue for granted and anticipate that politics automatically will be gender balanced in the future. The main take away of this study is that we need to focus more on supply-side explanations if we want to understand and overcome the gender imbalance in politics.